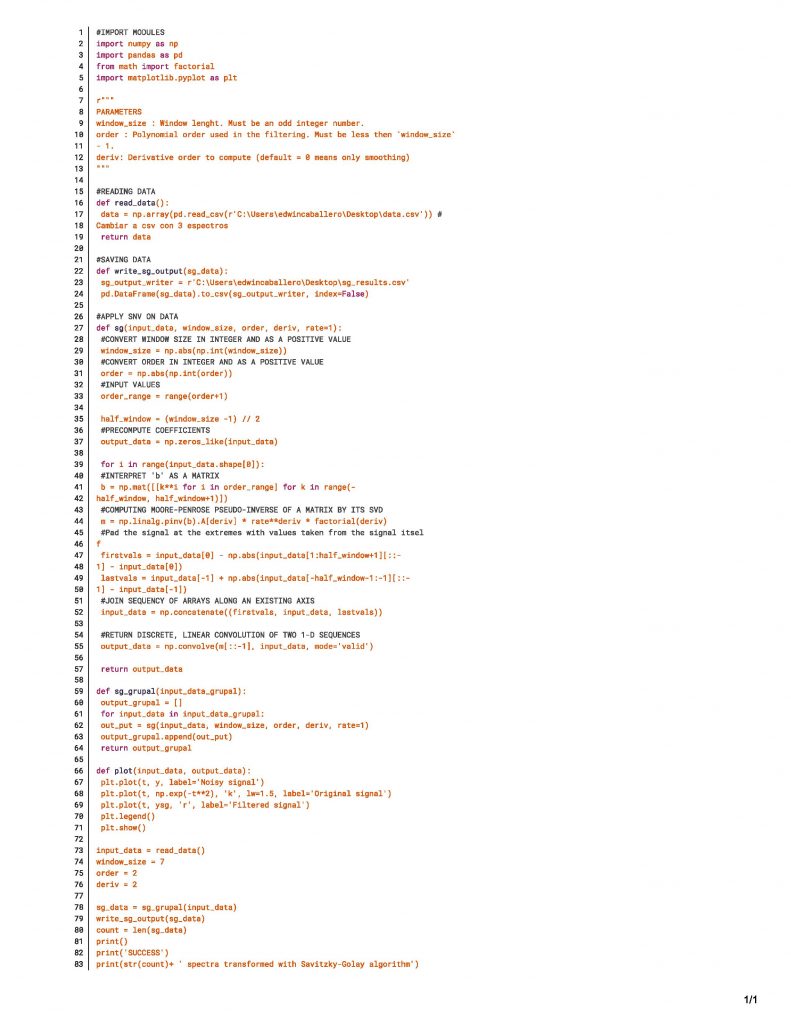
This Python script is a set of functions that apply the Savitzky-Golay (SG) algorithm to an input dataset. The SG algorithm is a smoothing and differentiation technique that can be used to process spectral data. The script first imports the numpy, pandas, math, and matplotlib.pyplot modules, which are used for numerical computing, data manipulation, mathematical operations, and plotting, respectively. The script includes a set of parameters that can be adjusted by the user: window_size, order, and deriv. The read_data function reads in the data from a .csv file on the user’s desktop using pandas.read_csv. The write_sg_output function writes the SG-processed data to a .csv file on the user’s desktop. The sg function applies the SG algorithm to an input dataset, and the sg_grupal function applies the SG algorithm to a group of input datasets. The plot function plots the original, noisy, and filtered signals. The script then reads in the data, applies the SG algorithm to the data, writes the SG-processed data to a file, and prints the number of spectra transformed with the SG algorithm.
How to Run the Code
- Save the script to a file on your computer.
- Make sure that you have the
numpy,pandas,math, andmatplotlibmodules installed. If you do not have these modules installed, you can install them usingpip install numpy,pip install pandas,pip install math, andpip install matplotlib, respectively. - Open a terminal or command prompt and navigate to the directory where the script is saved.
- Run the script using the command
python scriptname.py, wherescriptname.pyis the name of the script file. - The script will execute and apply the SG algorithm to the input data. The SG-processed data will be written to a
.csvfile on the user’s desktop and the number of spectra transformed with the SG algorithm will be printed. The original, noisy, and filtered signals will be plotted.
Overall Code
References:
- Harris, C. R.; Millman, K. J.; van der Walt, S. J.; Gommers, R.; Virtanen, P.; Cournapeau, D.; Wieser, E.; Taylor, J.; Berg, S.; Smith, N. J.; Kern, R.; Picus, M.; Hoyer, S.; van Kerkwijk, M. H.; Brett, M.; Haldane, A.; del Río, J. F.; Wiebe, M.; Peterson, P.; Gérard-Marchant, P.; Sheppard, K.; Reddy, T.; Weckesser, W.; Abbasi, H.; Gohlke, C.; Oliphant, T. E. Array Programming with NumPy. Nature 2020, 585 (7825), 357–362. https://doi.org/10.1038/s41586-020-2649-2.
- Reback, J.; McKinney, W.; jbrockmendel; Bossche, J. van den; Augspurger, T.; Cloud, P.; gfyoung; Sinhrks; Klein, A.; Roeschke, M.; Hawkins, S.; Tratner, J.; She, C.; Ayd, W.; Petersen, T.; Garcia, M.; Schendel, J.; Hayden, A.; MomIsBestFriend; Jancauskas, V.; Battiston, P.; Seabold, S.; chris-b1; h-vetinari; Hoyer, S.; Overmeire, W.; alimcmaster1; Dong, K.; Whelan, C.; Mehyar, M. Pandas-Dev/Pandas: Pandas 1.0.3. March 18, 2020. https://doi.org/10.5281/ZENODO.3715232.
- Hunter, J. D. Matplotlib: A 2D Graphics Environment. Comput Sci Eng 2007, 9 (3), 90–95. https://doi.org/10.1109/MCSE.2007.55.
- van Rossum, G. Python Reference Manual; Centrum voor Wiskunde en Informatica (CWI), 1995.


