This Python script is a tool for comparing spectral data. It performs two main functions: calculating the “HQI” (which stands for “hit quality index”) of two sets of spectral data, and calculating the correlation coefficient between two sets of spectral data. The script reads in two sets of spectral data from .csv files and then processes them using the “HQI” and “Correl” functions, which compare the spectra element-wise and return a measure of similarity between the two sets of data. Finally, the script writes the results of these calculations to two new .csv files, one for each of the comparison methods.
How to Run the Code
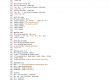
- Make sure you have the necessary Python modules installed. At the top of the script, the following modules are imported:
numpy,pandas, andmath. If you don’t already have these modules installed, you can install them by running the following command in your terminal:pip install numpy pandas math. - Prepare your spectral data. The script expects two sets of spectral data in .csv format, one for the “library” data and one for the “unknown” data. Each .csv file should contain one column for the spectral data, with the data points in rows.
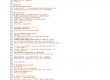
- Modify the file paths in the script to point to the .csv files containing your spectral data. The file paths are currently set to:
path_lib_data = r'C:\Users\edwincaballero\Desktop\HQI Program\library_data.csv'

path_unk_data = r'C:\Users\edwincaballero\Desktop\HQI Program\unknown_data.csv'
Change these file paths to the file paths of your spectral data .csv files.
- Run the script. You can do this by opening a terminal, navigating to the directory containing the script, and running the following command:
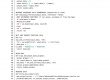
python script_name.py, wherescript_name.pyis the name of your script file. - The script will read in the spectral data from the .csv files, calculate the HQI and correlation coefficient for each pair of spectra, and then write the results to two new .csv files:
hqi_results.csvandcorrel_results.csv. The file paths for these output .csv files are currently set to:
path_hqi = r'C:\Users\edwincaballero\Desktop\HQI Program\hqi_results.csv'

path_correl = r'C:\Users\edwincaballero\Desktop\HQI Program\correl_results.csv'
You can change these file paths to specify where you want the output .csv files to be saved.
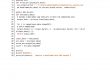
- When the script finishes running, it will print a success message to the terminal, indicating the number of library spectra that were compared to the number of unknown spectra, and the total number of HQI and correlation coefficient values that were calculated.
Overall Code
References:
- Harris, C. R.; Millman, K. J.; van der Walt, S. J.; Gommers, R.; Virtanen, P.; Cournapeau, D.; Wieser, E.; Taylor, J.; Berg, S.; Smith, N. J.; Kern, R.; Picus, M.; Hoyer, S.; van Kerkwijk, M. H.; Brett, M.; Haldane, A.; del Río, J. F.; Wiebe, M.; Peterson, P.; Gérard-Marchant, P.; Sheppard, K.; Reddy, T.; Weckesser, W.; Abbasi, H.; Gohlke, C.; Oliphant, T. E. Array Programming with NumPy. Nature 2020, 585 (7825), 357–362. https://doi.org/10.1038/s41586-020-2649-2.
- Reback, J.; McKinney, W.; jbrockmendel; Bossche, J. van den; Augspurger, T.; Cloud, P.; gfyoung; Sinhrks; Klein, A.; Roeschke, M.; Hawkins, S.; Tratner, J.; She, C.; Ayd, W.; Petersen, T.; Garcia, M.; Schendel, J.; Hayden, A.; MomIsBestFriend; Jancauskas, V.; Battiston, P.; Seabold, S.; chris-b1; h-vetinari; Hoyer, S.; Overmeire, W.; alimcmaster1; Dong, K.; Whelan, C.; Mehyar, M. Pandas-Dev/Pandas: Pandas 1.0.3. March 18, 2020. https://doi.org/10.5281/ZENODO.3715232.
- van Rossum, G. Python Reference Manual; Centrum voor Wiskunde en Informatica (CWI), 1995.

Classifies, quantifies, and explores data using spectroscopy techniques coupled with chemometric routines.