This R script performs a Principal Component Analysis (PCA) using the Non-linear Iterative Partial Least Squares (NIPALS) algorithm. The input file is an Excel file specified in the “path” variable, and the output files for PCA scores, loadings, and explained variance are specified in “output_path_scores,” “output_path_loadings,” and “output_path_var,” respectively. The number of principal components to use is set to 4. The script reads the data from the input file, extracts the first column as the category column (class), and then performs the PCA analysis on the remaining columns. The percentage of explained variance for each principal component is extracted, and the results are written to the output files. The PCA scores data frame contains the category-column (class) and the scores for each principal component. The PCA loadings data frame contains the loadings for each principal component, and the PCA explained variance data frame contains the percentage of explained variance for each principal component. Finally, the “write_xlsx” function is used to write the PCA scores, loadings, and explained variance data frames to their respective output files.
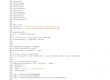
How to Run the Code
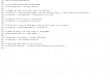
- Install the required libraries: readxl, writexl, and plsdepot. This can be done using the following command in R console:
install.packages(c("readxl", "writexl", "plsdepot"))
- Make sure that the input data file is in Excel format and that the file path is correctly specified in the code. Modify the “path” variable to point to the location of the input file.
- Modify the output file paths for scores, loadings, and explained variance files according to your preferred output directory.
- Set the number of principal components to use by modifying the “number_of_principal_components” variable in line 19.
- Ensure that the category column (class) is in the first column of the input data file. If it is not in the first column, modify line 23 to specify the correct column number.
- Copy and paste the code into the R console and press Enter to run the code.
- After running the code, three output files will be generated: pca_scores.xlsx, pca_loadings.xlsx, and pca_explained_var.xlsx. These files will contain the PCA scores, loadings, and explained variance, respectively.
Overall Code
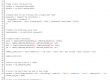
#PRINCIPAL COMPONENT ANALYSIS (PCA) with NIPALS
#Column 1 needs to be the category-column (class)
#If there is more than one category column, modify line 19 and 23.
+--------------+-------------+-------------+-----+-----+-----+-----+-----+
| Class | Var 01 | Var 02 | ... | ... | ... | ... | ... |
+--------------+-------------+-------------+-----+-----+-----+-----+-----+
| Class 1 | Value | Value | ... | ... | ... | ... | ... |
| Class 1 | Value | Value | ... | ... | ... | ... | ... |
| Class 2 | Value | Value | ... | ... | ... | ... | ... |
| ... | ... | ... | ... | ... | ... | ... | ... |
+--------------+-------------+-------------+-----+-----+-----+-----+-----+
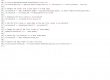
# Import necessary libraries
library(readxl) # For reading Excel files
library(writexl) # For writing Excel files
library(plsdepot) # For PCA analysis
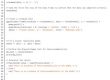
# Fill in the file paths for the input and output files
path = "C:\\Users\\barbi\\Desktop\\data.xlsx" # Input file path
output_path_scores = "C:\\Users\\barbi\\Desktop\\pca_scores.xlsx" # Output file path for scores
output_path_loadings = "C:\\Users\\barbi\\Desktop\\pca_loadings.xlsx" # Output file path for loadings
output_path_var = "C:\\Users\\barbi\\Desktop\\pca_explained_var.xlsx" # Output file path for explained variance
# Set the number of principal components to use
number_of_principal_components <- 4
# Read in the data from the input file
data <- read_excel(path)
df <- data.frame(data)
# Extract the first column as the category-column (class)
class <- data.frame(data[1])
# Perform PCA analysis using the NIPALS algorithm
output <- nipals(df[-1], comps = number_of_principal_components)
# Extract the percentage of explained variance for each principal component
pca_var <- output$values$percentage
# Create data frames for PCA scores, loadings, and explained variance
# The PCA scores data frame contains the category-column (class) and the scores for each principal component
pca_scores <- data.frame(class, output$scores)
pca_scores <- pca_scores[, c(1, seq(2, ncol(pca_scores)))]
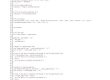
# The PCA loadings data frame contains the loadings for each principal component
pca_loadings <- data.frame(t(output$loadings))
pca_loadings <- cbind(df[1:number_of_principal_components, 1], pca_loadings)
# Remove the "X" prefix from column names
colnames(pca_loadings)[-1] <- gsub("^X", "", colnames(pca_loadings)[-1])
# Rename the first column to "PCs" and eliminate the second column
pca_loadings <- cbind(seq_len(number_of_principal_components), pca_loadings)
colnames(pca_loadings)[1] <- "PCs"
pca_loadings <- pca_loadings[,-2]
# The PCA explained variance data frame contains the percentage of explained variance for each principal component
pca_exvar <- data.frame(pca_var)
# Write the PCA scores, loadings, and explained variance data frames to the output files
write_xlsx(pca_scores, output_path_scores)
write_xlsx(pca_loadings, output_path_loadings)
write_xlsx(pca_exvar, output_path_var)
References:
- Wickham, Hadley; Bryan, J. Readxl: Read Excel Files. 2019. https://cran.r-project.org/package=readxl.
- Stevens, A.; Ramirez-Lopez, L. An introduction to the prospectr package. R package Vignette.
- Ooms, J. writexl: Export Data Frames to Excel “xlsx” Format.
- Wickham, H.; Vaughan, D.; Ushey, K. tidyr: Tidy Messy Data.
- Wickham, H. Reshaping Data with the Reshape Package. J Stat Softw 2007, 21 (12), 1–20.
- Wickham, H. Dplyr: A Grammar of Data Manipulator. 2021.
- R Core Team. R: A Language and Environment for Statistical Computing. R Foundation for Statistical Computing: Vienna, Austria 2021. https://www.r-project.org/.

Classifies, quantifies, and explores data using spectroscopy techniques coupled with chemometric routines.