Index
- What is the Biological Condition Gradient?
- CCRI’s role regarding the BCG
- Project goals
- Study sites
- BCG app
- Our team
- References
What is the Biological Condition Gradient (BCG)?
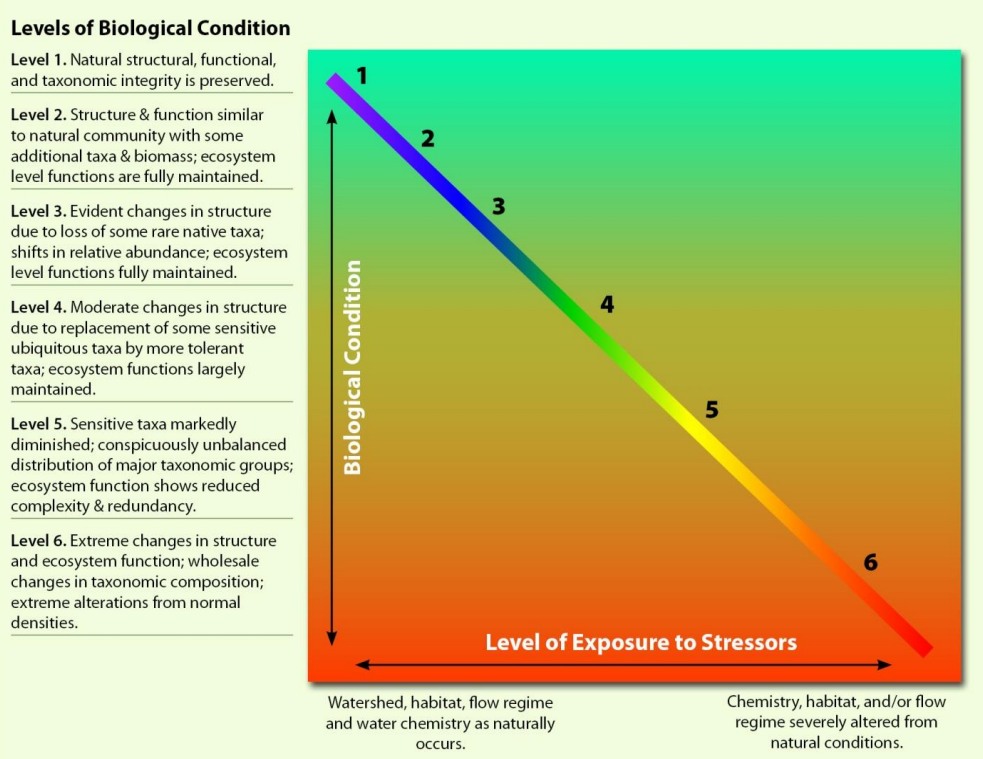
The BCG is a numerical model that was initially developed as an approach to assess the biological condition (or “health”) of a freshwater body relative to expectations of “having a composition and diversity comparable to that of the natural habitat” (see Bradley et al. 2020 and Santavy et al. 2012).
Currently, the BCG can be fed information about different components of coral reef sites (e.g. reef fish assemblages or benthic species) and uses that information to deliver a value between 1 and 6 that represents the relative health of those ecosystems (figure 1). The BCG is therefore a useful tool to describe how biological conditions change incrementally along a gradient of increasing anthropogenic stress.
Since fish and benthic assemblages may respond differently to stressors, combining fish and benthic BCG models would allow for a more robust understanding of these systems (Bradley et al. 2020).
If the fish and benthic BCGs are additionally coupled with water quality data, the BGC provides a statistically stronger framework to understand the state of coral reef sites. This information can then used to inform management decisions like identifying which water bodies containing coral reefs should be prioritized, protected and/or restored (Bradley et al. 2020).
CCRI’s role regarding the BCG
In accordance with the guidance of the U.S. Environmental Protection Agency (EPA 2002, 2013) and in support of the U.S. Clean Water Act and biocriteria, the Caribbean Coral Reef Institute (CCRI) and the Puerto Rico Department of Natural and Environmental Resources (PR-DNER) developed a two-year monitoring program for: 1) seawater chemistry, 2) benthic communities, and 3) fish assemblages.
Project Goals
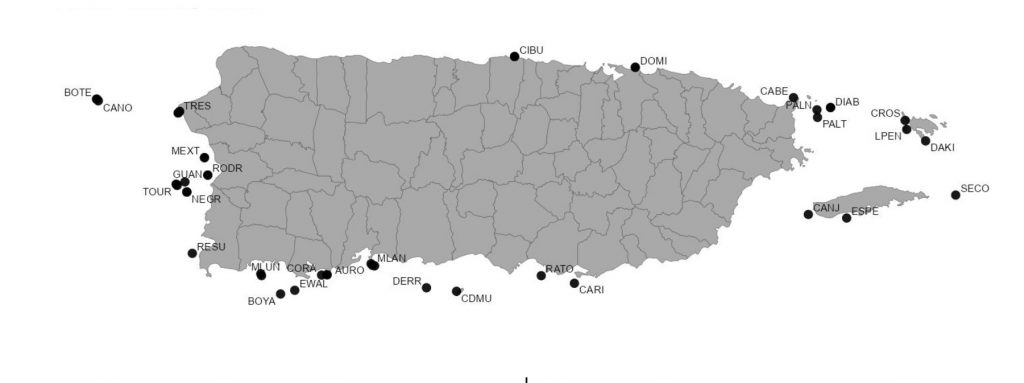
- Calculate the BCG level of seawater chemistry, reef fish assemblages, and benthic assemblages at 42 sites (figure 2) studied by the Puerto Rico Coral Reef Monitoring Program
- statistically assess stressor-response relationships and,
- use this data to support management in coral reef sites.
This project is currently administered and conducted by CCRI from the University of Puerto Rico at Mayaguez (UPRM). The funding provided has allowed us to build the first seawater quality monitoring laboratory from a public institution in Puerto Rico and is located at UPRM’s Isla Magueyes Marine Laboratory in La Parguera, Lajas P.R. The Water Quality Laboratory became fully functional on May 2023.
Study Sites
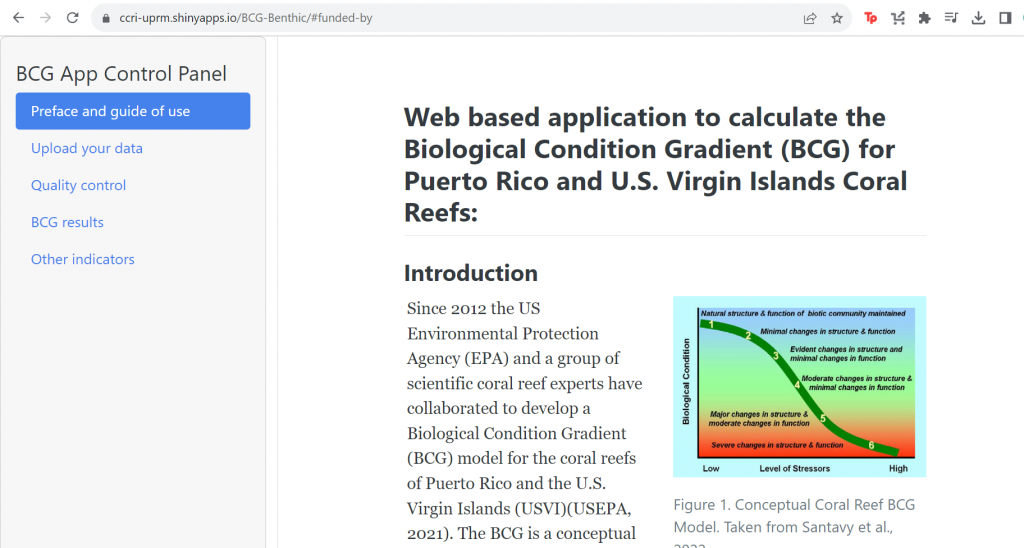
The BCG application
CCRI is collaborating to create a “BCG shiny app”, which would allow us to upload data on corals, reef fish, and water quality parameters to calculate the BCG and create a map that showcases the BCG results for each location.
The application is publicly available (click here) but is currently working ONLY with coral assemblage data collected using Line-Point-Intercept (LPI) and benthic demographic (DEMO) methods.
How to use the app
- You can download practice datasets by clicking here.
- Go to:
- Download the template_v2.xlsx from the “How to use this app” section on the “Preface and guide of use“:
- Read and follow the instructions on the first sheet titled “INSTRUCTIONS” to complete the sheets titled: “LPI”, “MOBILE_FAUNA”, and “DEMO”.
- In order for the BCG to work properly, DO NOT edit the name or change the position of the sheets or columns in any of the template documents.
- Go to: “Upload your data” in the Main Menu, click “Browse…“, and select the template_v2.xlsx you prepared in step 3.
- Once you select the file, upload should start automatically and the application will show a preview of the uploaded data.
- Select the model you wish calculated (BCG requires both LPI and DEMO data while the BSAT model only requires LPI data).
- On the bottom of this page, select Temporal (e.g., YEAR) and Spatial (e.g., SITE) factors to consider for analysis.
- Continue to Quality Control in the Main Menu and click Go!
- This process may take a few minutes depending on the size of your dataset and internet connection speed.
- Click on Download data to recover a list of Species names that:
- Were identified by marinespeces.org but need to be added to the Master List
- Were identified by marinespeces.org but might have been misspelled
- Were not identified and need to be included in the Master List as a biological variable or otherwise.
- If new species need to be added to the Master List, contact us at ccri@uprm.edu.

- Continue on to BCG results
- This process may also take a couple of minutes depending on the size of your dataset.
- Once the process is finished, you can:
- Download metrics
- Download results
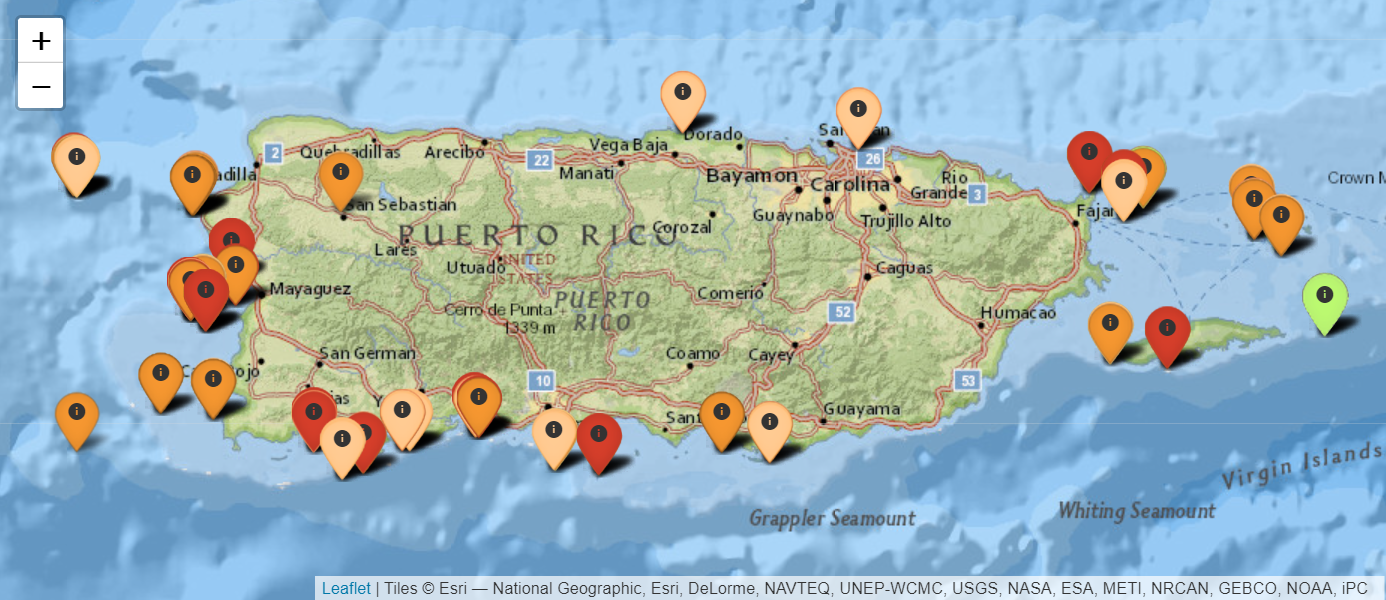
- Download map
- Review your data
- In figure 4 only site SECO30 (in light green) had a BCG level 3.
- All other sites measured between levels 4 – 6 showing the vast degradation of coral health in Puerto Rico compared to “pristine” sites.
- In figure 4 only site SECO30 (in light green) had a BCG level 3.

Meet our team!
UPRM – CCRI – Department of Marine Sciences
- Juan Jose Cruz-Motta, Ph.D. – Project coordinator
- Travis Courtney, Ph.D. – Chemistry lab director
- Ernesto Weil, Ph.D. – Project advisor
- Patricia Bradley, Ph.D. – Project advisor
- Martha Ricaurte, Ph.D. – Chemistry lab manager
- Carla L. Mejias, Ph.D. student – Chemist
- Manuel A. Nieves-Ortiz, M.Sc. – Project manager
U.S. Environmental Protection Agency (EPA)
- Izabela Wojtenko
- Carol Lynes – USEPA Quality Assurance Officer
Subcontracted personnel
- Edlin Guerra Castro – Shiny App Programmer
- Arturo Sánchez Porras – Shiny App Programmer
References
- Bradley P. et al. (2020) Development of a reef fish biological condition gradient model with quantitative decision rules for the protection and restoration of coral reef ecosystems. Marine Pollution Bulletin 159:111387. pp. 55.
- Environmental Protection Agency (EPA 2016) A practitioner’s guide to the Biological Condition Gradient: a framework to describe incremental change in aquatic ecosystems. Fact Sheet for Water Quality Managers. EPA/822F-16/002 February 2016. pp. 2.
- EPA & NOAA (2023) Web based application to calculate the Biological Condition Gradient (BCG) for Puerto Rico and U.S. Virgin Islands Coral Reefs. Developed by: Edlin Guerrera Castro and Arturo Sánchez Porras. Shiny and R hosted at Shinyapps.io. Developed in github.
- Nieves Ortiz, M.A. et al. (2023) Poster presentation: Monitoring seawater chemistry, benthic communities, and fish assemblages to assess the health of coral reefs in Puerto Rico. AECiMa Marine Science Symposium 2023 – March 4th.
- Santavy DL, Fisher WS, Campbell JG and Quarles RL. 2012. Field Manual for Coral Reef Assessments. U.S. Environmental Protection Agency, Office of Research and Development, Gulf Ecology Division, Gulf Breeze, FL. EPA/600/R-12/029. April 2012.