Earthquake simulation by means of a shaking table, is a system that consists of several components which must be designed to effectively work together. The design concept of the UPRM Earthquake Simulator was the design of a small unidirectional servo-hydraulic shaking table facility. The final design consists of a rigid platform sliding over a near frictionless linear bearing system and driven by an actuator attached to a reaction frame as shown in Figure 1. Figure 2 shows the west and east views of the UPRM Earthquake simulator.
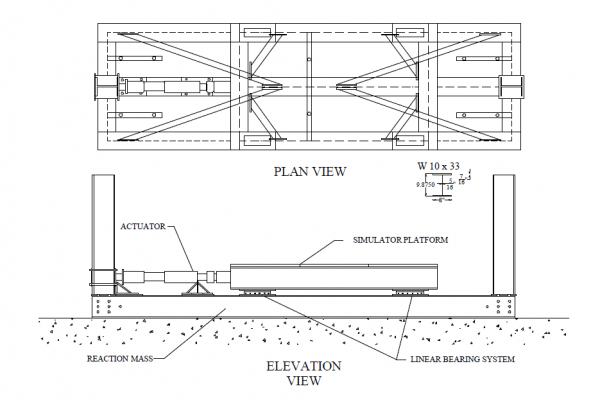
Figure 1. Plan end elevation views of final design. [1]
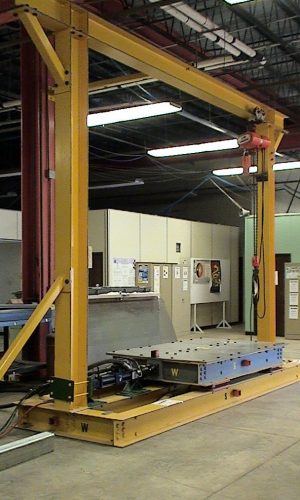
Figure 2. UPRM Earthquake Simulator. [1]
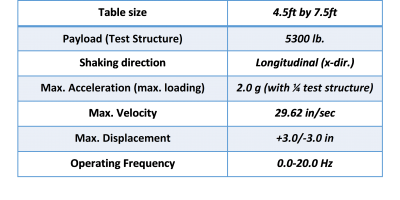
Table 1. UPRM Earthquake simulator main properties.
The components of the UPRM Shaking Table facility can be summarized in the following:
- Reaction Frame
- Simulator Rigid Platform
- Linear Roller Bearings
- Hydraulic Power Unit
- Servovalve and Actuator
- Servo-Controller
These components work together as described in Figure 3. The process is initiated by a signal from the Control Computer to activate the Hydraulic Pump Unit (HPU) and the Hydraulic Service Manifold (HSM). The HPU delivers constant flow of hydraulic fluid. The HSM distributes this hydraulic fluid to the different actuator channels. The HSM houses a pressure accumulator and return accumulator. This helps the system during peak flow demands. The same Control Computer sends a displacement command signal to the Servo-Controller that controls the displacement of the actuator and the simulator platform. The Servo-Controller uses a closed-loop system that provides continuous correction signals for a controlled simulator platform displacement. The closed loop servo-system uses a linear variable differential transformer (LVDT), which is located within the actuator, to make these corrections by comparing the command signal with the LVDT signal. This generates an error signal that is sent to the servo-valves, 20 which controls the amount and direction of the pressurized hydraulic fluid port to the actuator chambers from the HSM, and thus controls the direction of the actuator movement. The measurement transducers measure the motion of the platform and send the measured signals to the Data Acquisition System to be stored.
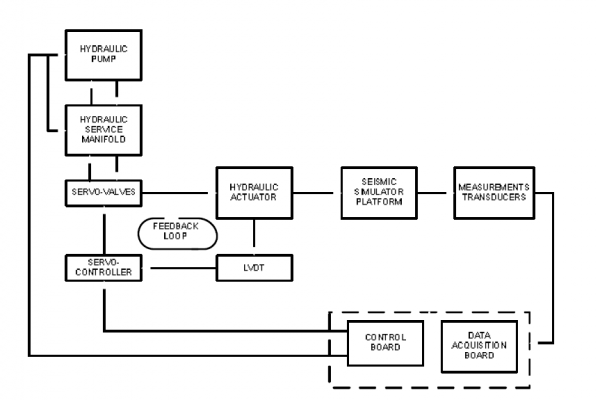
Figure 3. Block Diagram of Seismic Simulator. [3]
The overall main objective of the development, construction and calibration of the earthquake simulator was to provide the UPRM with a shaking table facility for testing of behavior of scaled structural models under dynamic loading, such as earthquakes. The process of developing this facility consisted of:
- Development and design: The most important variables of the design of the shaking table are:
- Test Model (scale and type of model) – gives the scaling laws that will govern the design.
- Expected type of loading (type of earthquakes) – gives the maximum values of acceleration, velocity and displacement that will give the appropriate hydraulic system.
- Oil Column Frequency – will give the maximum theoretical operating frequency of the system.
- Mass ratios ((test structure/simulator platform) and (simulator platform/foundation mass)) – will give an insight of the table expected dynamics.
- Construction and assembly of components: In the construction phase of the shaking table, it was found the most important steps are:
- The alignment and leveling of the linear roller bearings
- The alignment and leveling of the actuator
- Any misalignment of the linear bearings or the actuator will introduce friction and rotational modes.
- Measuring of performance: From these calibration tests the following information was obtained:
- The earthquake simulator is capable of periodic motion and has been found operational at a range of 0.0 – 20.0 Hz.
- The response of the system increased with increases in proportional gain.
- The error percent, peak or valley, decreased with increases in proportional gain.
- There are some frequency components interacting at the operational frequency range. Of these frequencies we can identify the 30-33 Hz components as the oil column frequency
Performance Curves
The Theoretical Performance Envelopes for the bare table are shown in Figure 4 through Figure 6. Figure 4 shows the displacement vs. frequency performance envelope. Figure 5 shows the velocity vs. frequency performance envelope and Figure 7 displays the acceleration vs. frequency performance envelope. The blue curve shows a 0.0 N (0.0 kip) force and the green curve shows a 48.93 KN (11.0 kip) force.
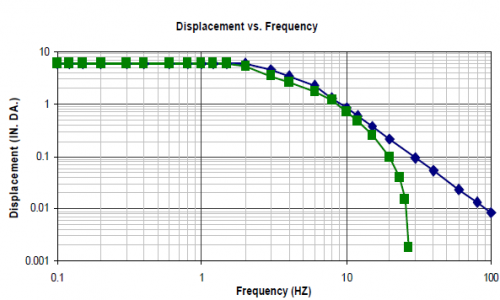
Figure 4. Displacement vs Frequency Performance Envelope. [1]
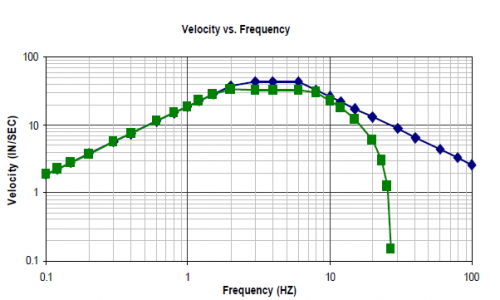
Figure 5. Velocity vs Frequency Performance Envelope [1]
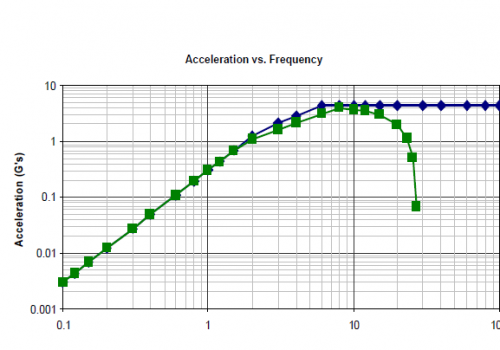
Figure 6. Acceleration vs Frequency Performance Envelope. [1]
References:
[1]. Cortes-Delgado, M., “DEVELOPMENT OF THE UPRM EARTHQUAKE SIMULATOR FOR DYNAMIC MODEL ANALYSIS”, M.S. Thesis, University of Puerto Rico at Mayaguez, Puerto Rico, June 2015.