Overview

Understanding what tsunami maps are and how they were developed is the first step in learning how to use them effectivelyThis module introduces you to the topic of tsunami maps and the Puerto Rico Seismic Network (PRSN) evacuation maps and the interactive Map Tool, including where to find them within the PRSN website.

Module Objectives

After completing this module, you will be able to:

    • Describe in general terms the difference between the blue flood zones and the yellow evacuation zones on the maps.
    • Explain the purpose of tsunami maps and the process used to develop tsunami evacuation zones shown on the maps.
    • Describe the PRSN evacuation maps and the Map Tool and explain to others where to find the PRSN tsunami map resources.

Tsunami Maps

Learning about tsunami maps begins with understanding tsunami flood maps and tsunami evacuation maps.  Tsunami flood maps show zones that are vulnerable to flooding due to a tsunami, whereas the evacuation maps show the areas that people must leave to be safe from tsunami waves (UNESCO, 2006, p. 8).  Sometimes, these evacuation maps include designated evacuation routes. 


The images below illustrate the differences between a tsunami flood map and an evacuation map. Click on the images to expand them, and take a few minutes to compare and contrast the different maps.

In the image on the left, the Blue Area is the Tsunami Flood Zone; in the image on the right, the Yellow Area is the Evacuation Zone. Note that in the evacuation maps, the yellow evacuation zones are typically larger than the blue flood zones to ensure safety in the event of a tsunami.

How Tsunami Maps Are Made

There are three factors involved in developing a tsunami flood map:

    1. Elevation
    2. Distance from the coast
    3. Computer modeling


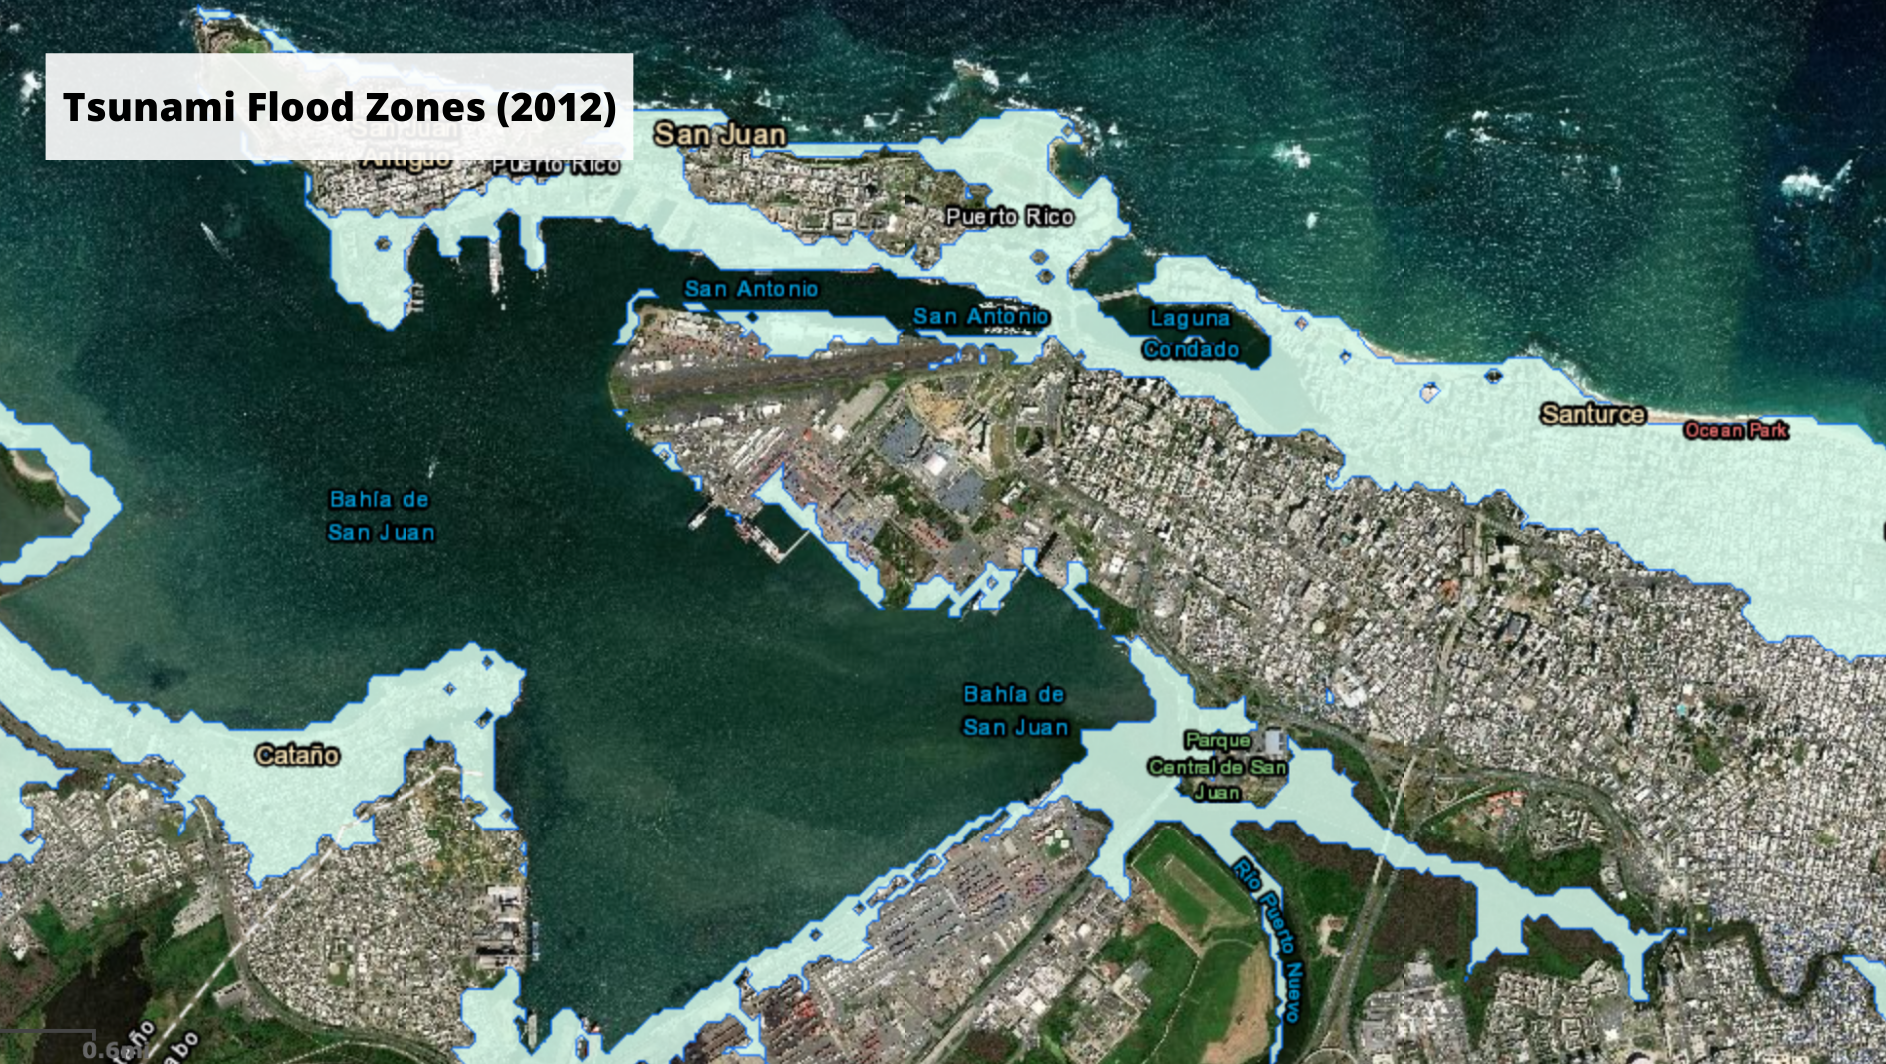
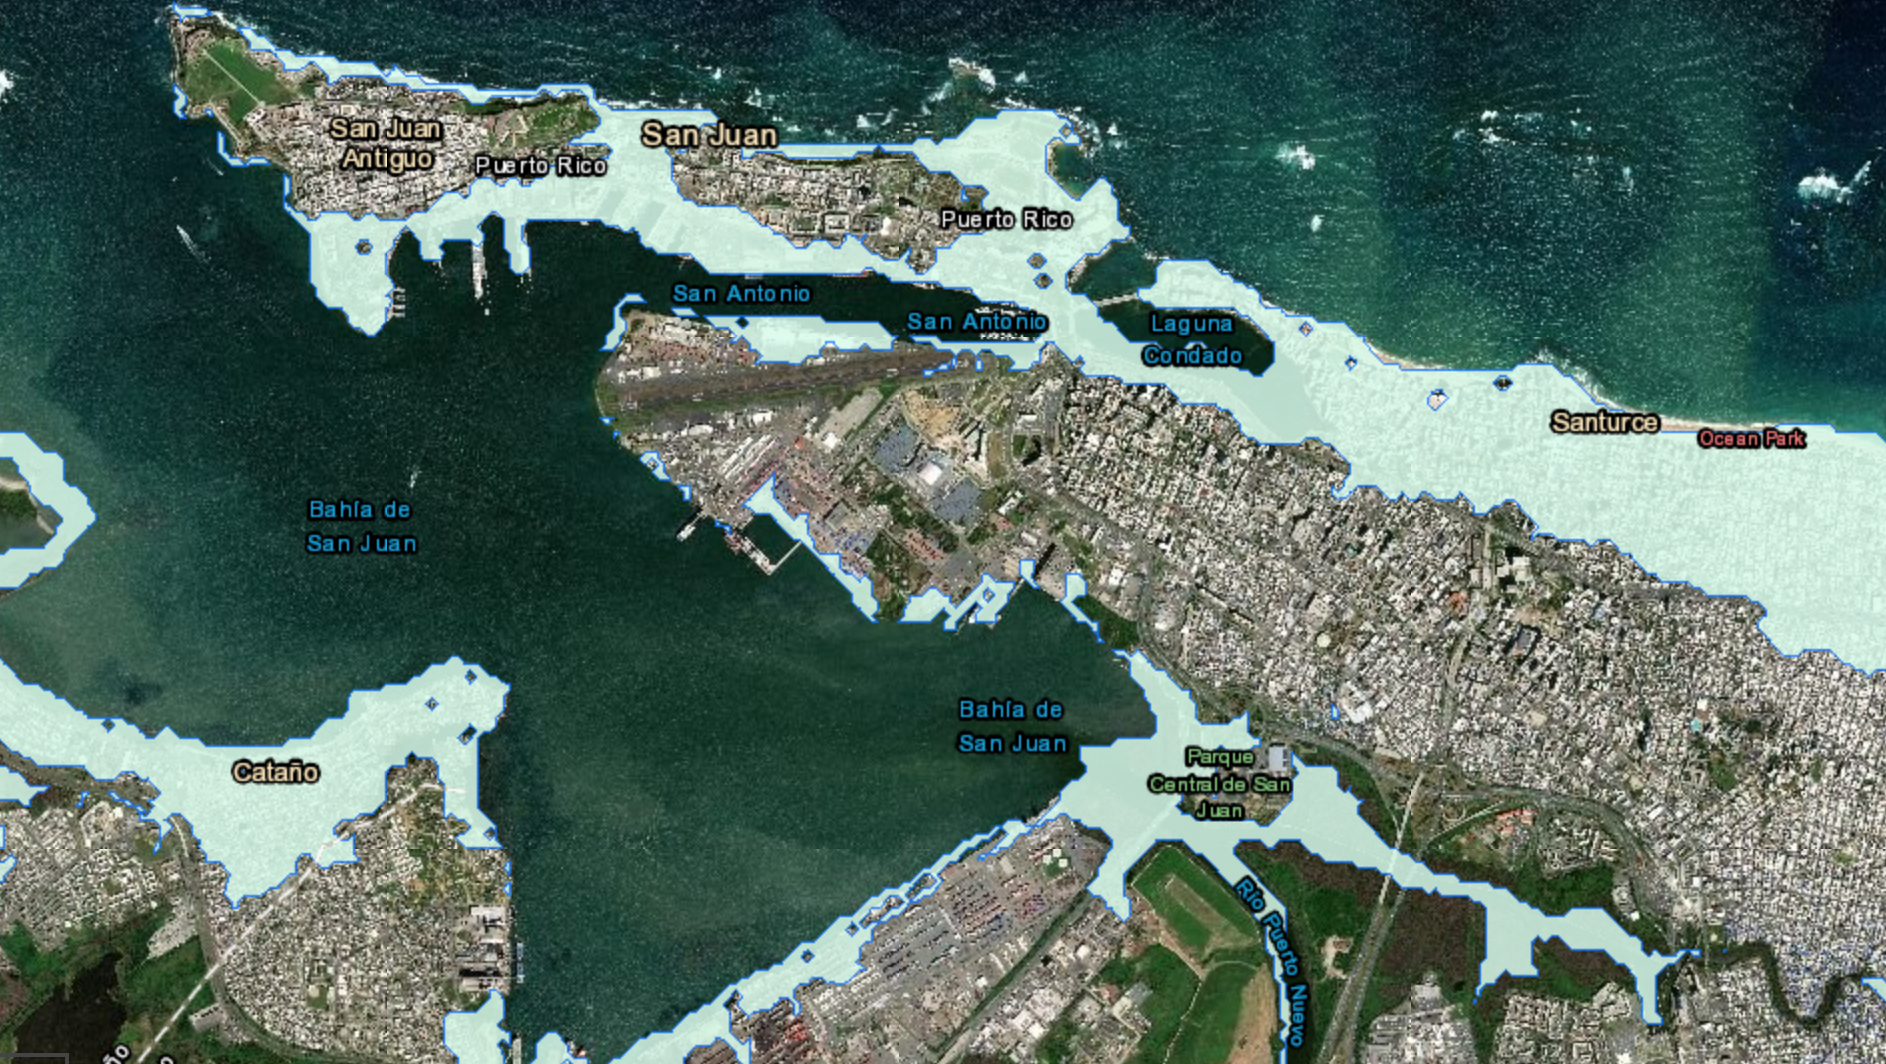
The Puerto Rico Seismic Network developed their tsunami maps using computer modeling.  The current PRSN tsunami map was developed in 2012, but it will be updated in the future as scientists learn more about potential tsunami sources in the region.


When developing the tsunami maps with computer modeling, the following criteria is used:

    1. Topography: The elevation of the land and its features
    2. Bathymetry: Measurement of the depth of the seabed near the coast
    3. Locations and strengths of local earthquakes.


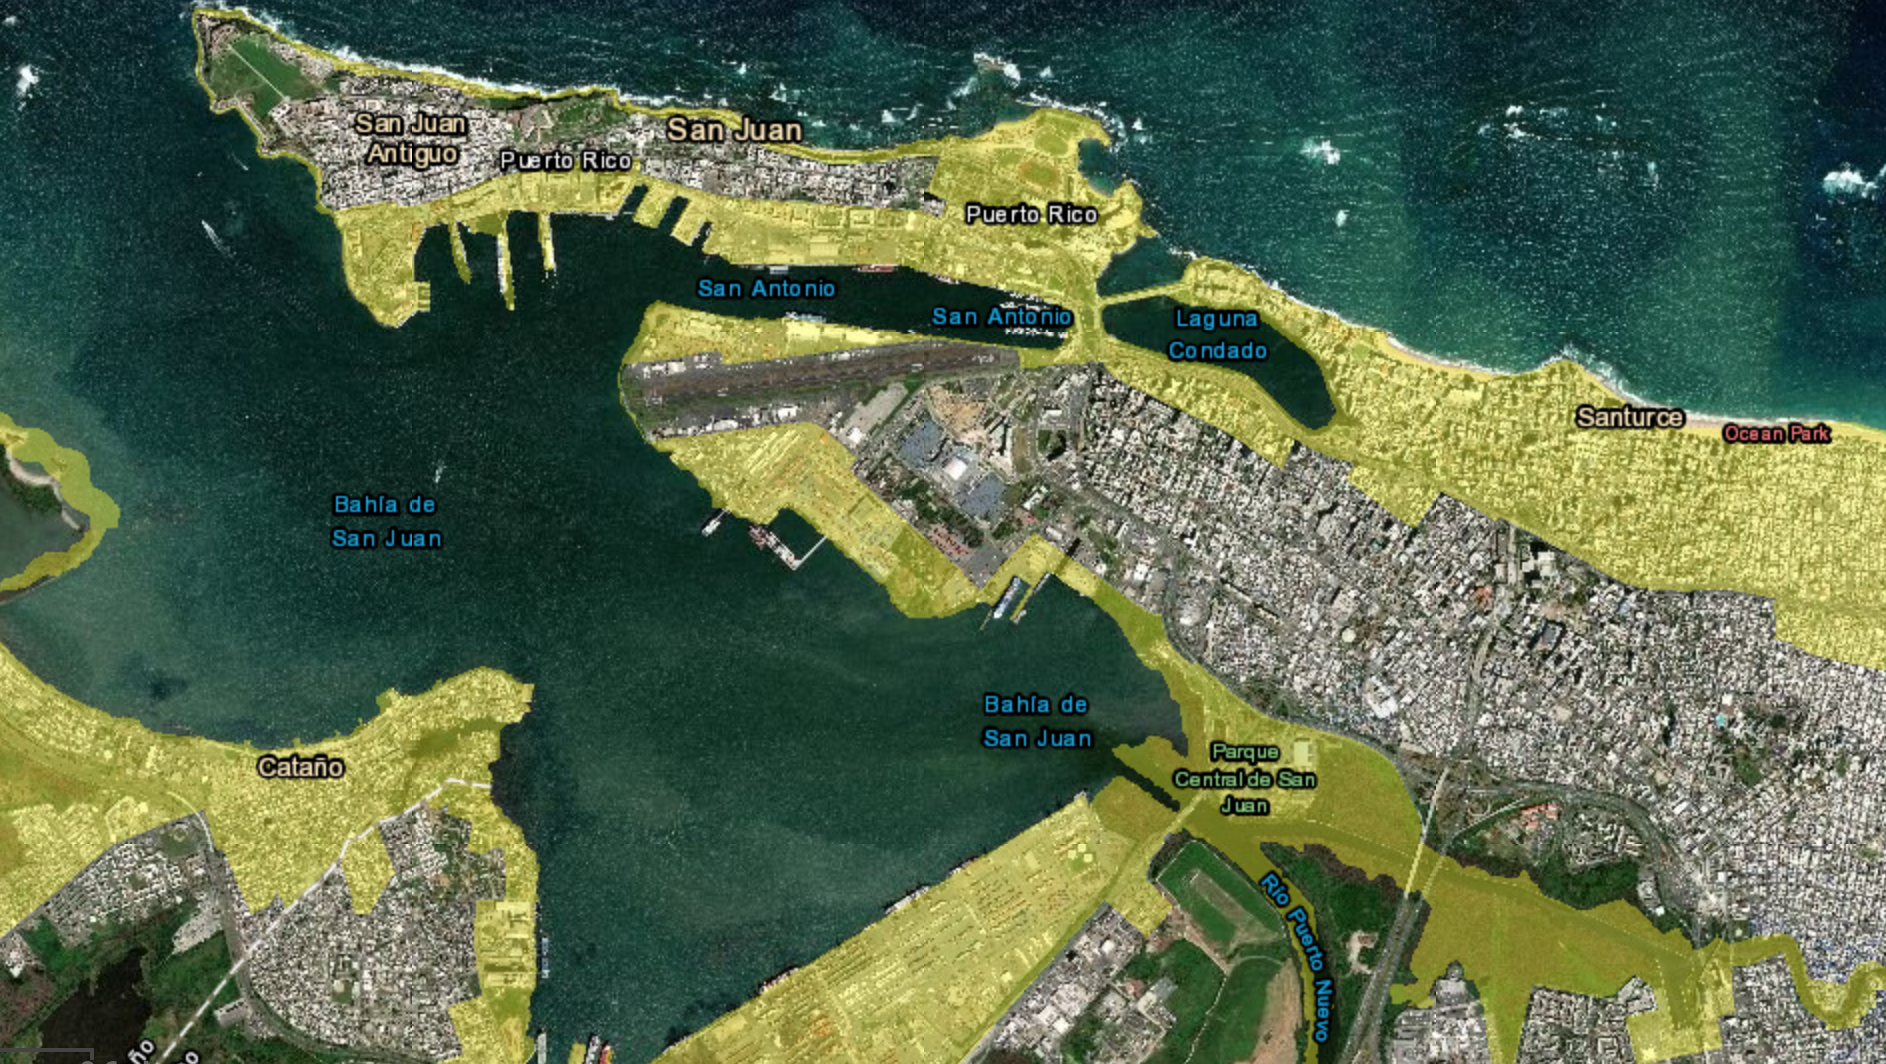
The last item (locations and strengths of local earthquakes) considers the possible sources of an earthquake in the ocean that could cause a tsunami—including a magnitude 8.0 earthquake to the north of Puerto Rico in the Atlantic Ocean.


Using this information to inform computer modeling, blue flood zones were identified as areas that could flood during a tsunami.

Was it interesting to read about tsunami maps?  We hope so! It is most important that you recognize the differences between the two types of zones and understand how the tsunami maps were made. 

PRSN’s Evacuation Maps and Map Tool

The Puerto Rico Seismic Network (PRSN) has two main online tsunami map resources: the evacuation maps and the interactive Map Tool.  These maps were only developed for areas that can be impacted by a tsunami event: all coastal municipalities in Puerto Rico as well as two inland municipalities (Bayamón and Canóvanas).  (If you are unfamiliar with Puerto Rican municipalities, a municipality in Puerto Rico is similar to a country in the United States.)  Also, PRSN has developed evacuation maps for the U.S. Virgin Islands (St. Croix, St. John, and St. Thomas); they are accessible the same ways as the Puerto Rico maps.


The image on the left is an example of a PRSN evacuation map (the municipality of Toa Baja), and the image on the right is the interactive Map Tool.  Click on the images to expand them.

Because the maps are updated when needed, we recommend accessing the evacuation maps repository and Map Tool through the PRSN website. Remember that throughout this course, you always have access to these resources at the top navigation menu under the Resources tab. 

Evacuation Maps

The PRSN evacuation maps were created following the TsunamiReady® program guidelines.  They are a tool for emergency management purposes and represent a worst-case tsunami scenario: a local tsunami.  This means that you have an hour or minutes to respond when a seismic event occurs very close to the coast of Puerto Rico.


See the instructions below for accessing the evacuation maps on the PRSN website and the Tsunami Program webpages.

Once you are inside the PRSN home page, (1) in the top menu, click “Earthquakes and Tsunamis” and (2) click the  “Evacuation Maps.” option.

Map Tool

The Map Tool is an interactive map based on Geographic Information Systems (GIS) that visualize the tsunami evacuation maps’ information layers and combine them with new layers.  The Map Tool is also referred to as the Puerto Rico Tsunami Program Map Tool and the Tsunami Decision Support Tool.


See the instructions below for accessing the Map Tool on the PRSN website and the Tsunami Program webpages. It is necessary to access the Puerto Rico Tsunami Program section to use the MapTool.

On the PRSN webpage (1) click on the “Earthquakes and Tsunamis” tab (2) click on the “Puerto Rico Tsunami Program”. The MapTool will be available on the right side of the screen.

To see the MapTool in full screen, click on the option Click here to see map on full screen, available in the left side of the screen.

Knowledge Check

Test your knowledge about this topic by answering the following questions. You can review the correct responses by hovering your mouse over the boards with the word “Answer.” Some questions require reviewing images.

1. What is the difference between blue zones and yellow zones on tsunami maps?

Answer

The blue areas are the flood zones and the yellow areas are the evacuation zones.

2. What additional criteria did PRSN use with computer modeling to develop tsunami flood maps?

Answer

Land elevation, seabed depth, and earthquake sources

3. What two online tsunami map resources does PRSN have available on their website?

Answer

Evacuation maps and the Map Tool

Apply

See the notification box below to apply what you learned.  Afterward, you can choose to continue with the next module or take a break and come back at another time.

Share with someone in your community!! (family, friends or even a coworker), let them know the differences between the blue and yellow zones on the tsunami maps. Show them where to find the evacuation maps and the Map Tool on the PRSN website!